Usage Logs
Usage logs track token consumption and cost per agent run. Use them to understand which agents and workflows drive the most LLM usage.
Viewing usage logs
Go to Settings → Logs → Usage in the Synapse UI.
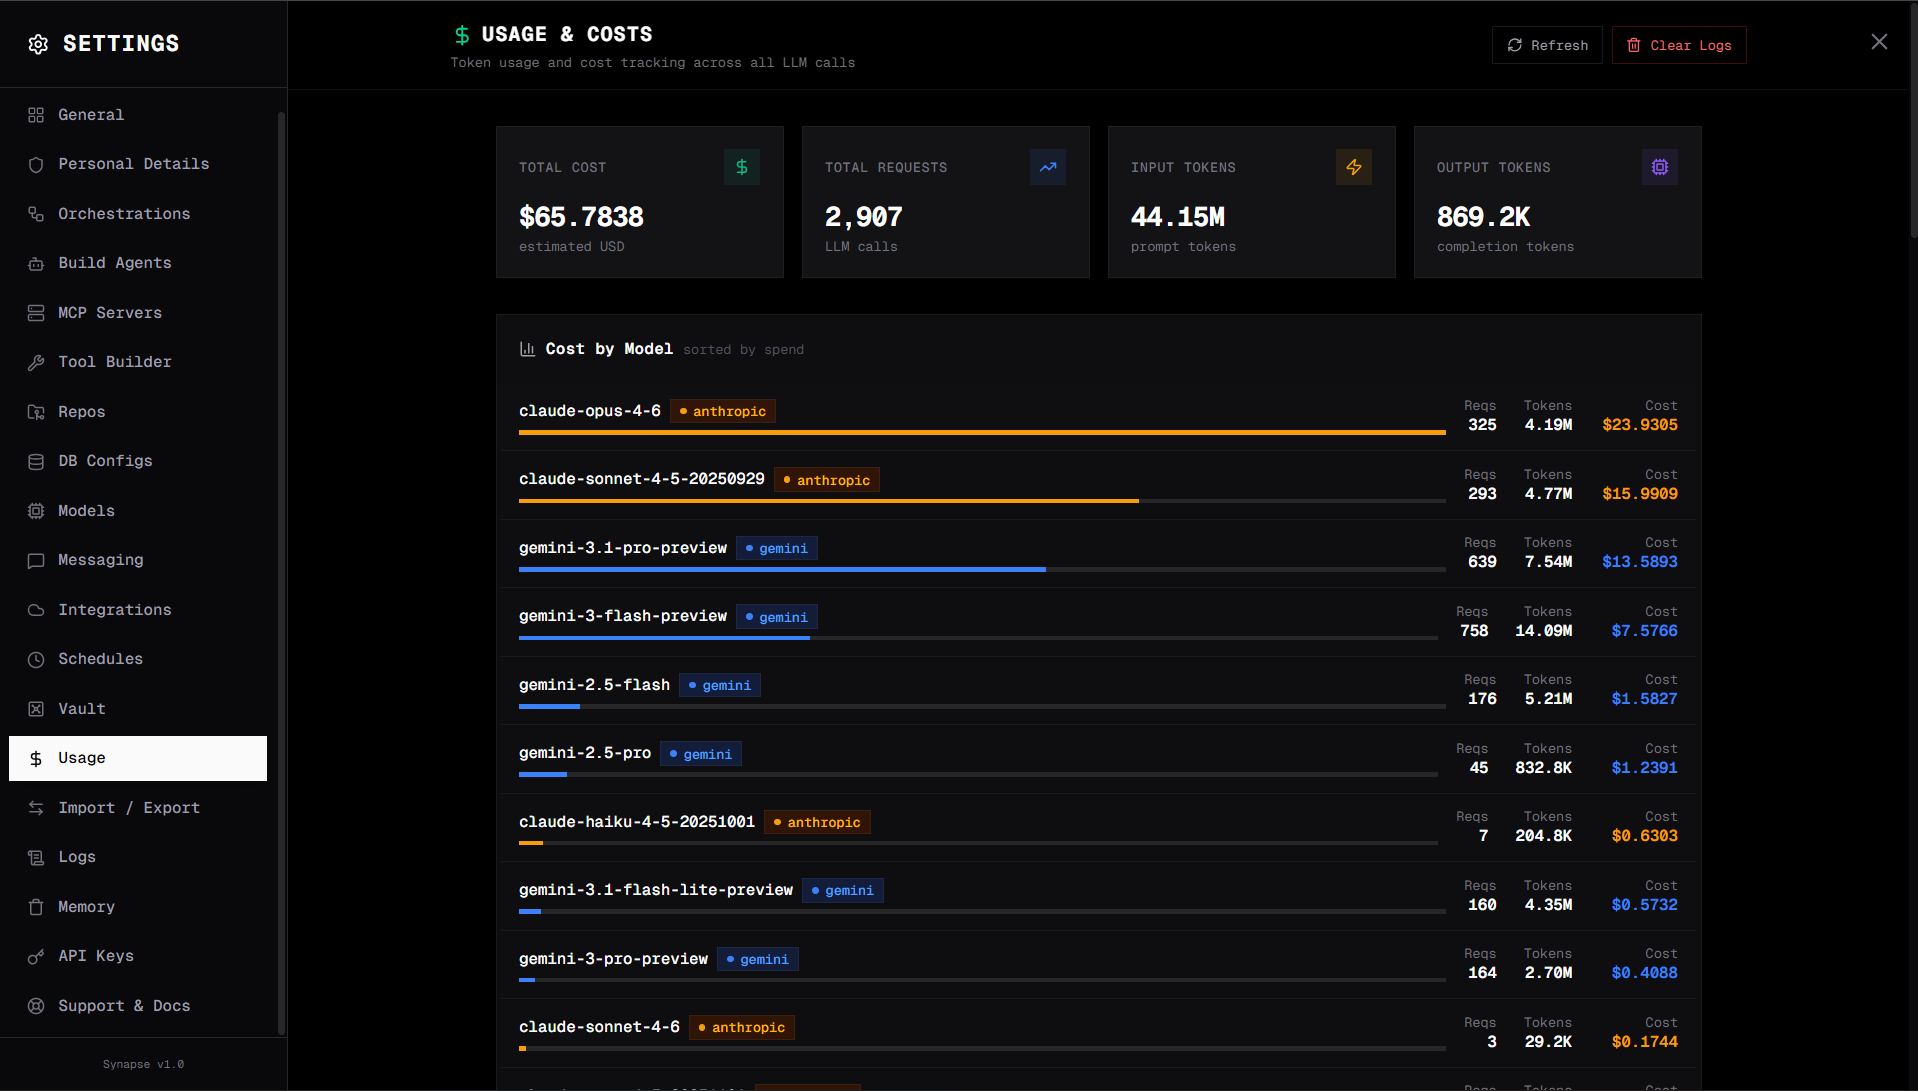
What's tracked
| Metric | Description |
|---|---|
| Total tokens | Input + output + cache read + cache write tokens per run |
| Input tokens | Cache-miss prompt tokens (billed at the full input rate) |
| Output tokens | Tokens generated by the model |
| Cache read tokens | Prompt tokens served from the prompt cache at a discounted rate |
| Cache write tokens | Prompt tokens written to the cache on first use (Anthropic / Bedrock only; one-time surcharge) |
| Estimated savings (USD) | What this call would have cost without the cache, minus what it actually cost |
| Response cache hit | true when the LLM call was skipped entirely via the response cache |
| Cost (USD) | Estimated cost based on the model's pricing, after cache adjustments |
| Model | The LLM used for the run |
| Agent / Orchestration | What triggered the run |
| Session ID | Conversation session |
| Timestamp | When the run occurred |
Cache tracking
Every usage record carries four cache fields alongside the usual token counts:
| Field | Meaning |
|---|---|
cache_read_tokens | Tokens served from the prompt cache. Billed at ~10–50% of the input rate, depending on provider |
cache_write_tokens | Tokens written into the cache on a first hit. Anthropic / Bedrock charge ~1.25× input for this; OpenAI / DeepSeek / Gemini do not |
estimated_savings | Per-call USD saved vs. paying full input rate for the cache_read_tokens |
response_cache_hit | true when the entire LLM call was satisfied by the response cache (no provider call was made) |
These are summed and surfaced in the Settings → Usage dashboard:
- Total Cache Read Tokens / Total Cache Write Tokens — workspace-wide totals
- Total Estimated Savings — sum of
estimated_savingsacross all runs - Total Response Cache Hits / Response Cache Hit Rate — count + fraction of LLM calls served entirely from the response cache
- By Model — per-model cache activity, so you can tell which models actually benefit
- By Run — per-orchestration-run breakdown, useful for cost-attributing a specific pipeline
- Disk Stats — per-namespace entry count and bytes on disk for
responses_exact/,responses_semantic_*/, andtool_results/
Sample log record with cache activity:
{
  "timestamp": "2026-05-23T14:02:11.873Z",
  "model": "claude-3-5-sonnet-20241022",
  "provider": "anthropic",
  "session_id": "sess-abc123",
  "agent_id": "agent-researcher",
  "source": "chat",
  "input_tokens": 412,
  "output_tokens": 187,
  "cache_read_tokens": 8421,
  "cache_write_tokens": 0,
  "total_tokens": 9020,
  "estimated_cost": 0.00408,
  "estimated_savings": 0.02273,
  "response_cache_hit": false,
  "latency_seconds": 1.84
}
For a response-cache hit, input_tokens and output_tokens reflect the cached completion's original token counts, response_cache_hit is true, and estimated_cost is 0. See Caching for the full design.
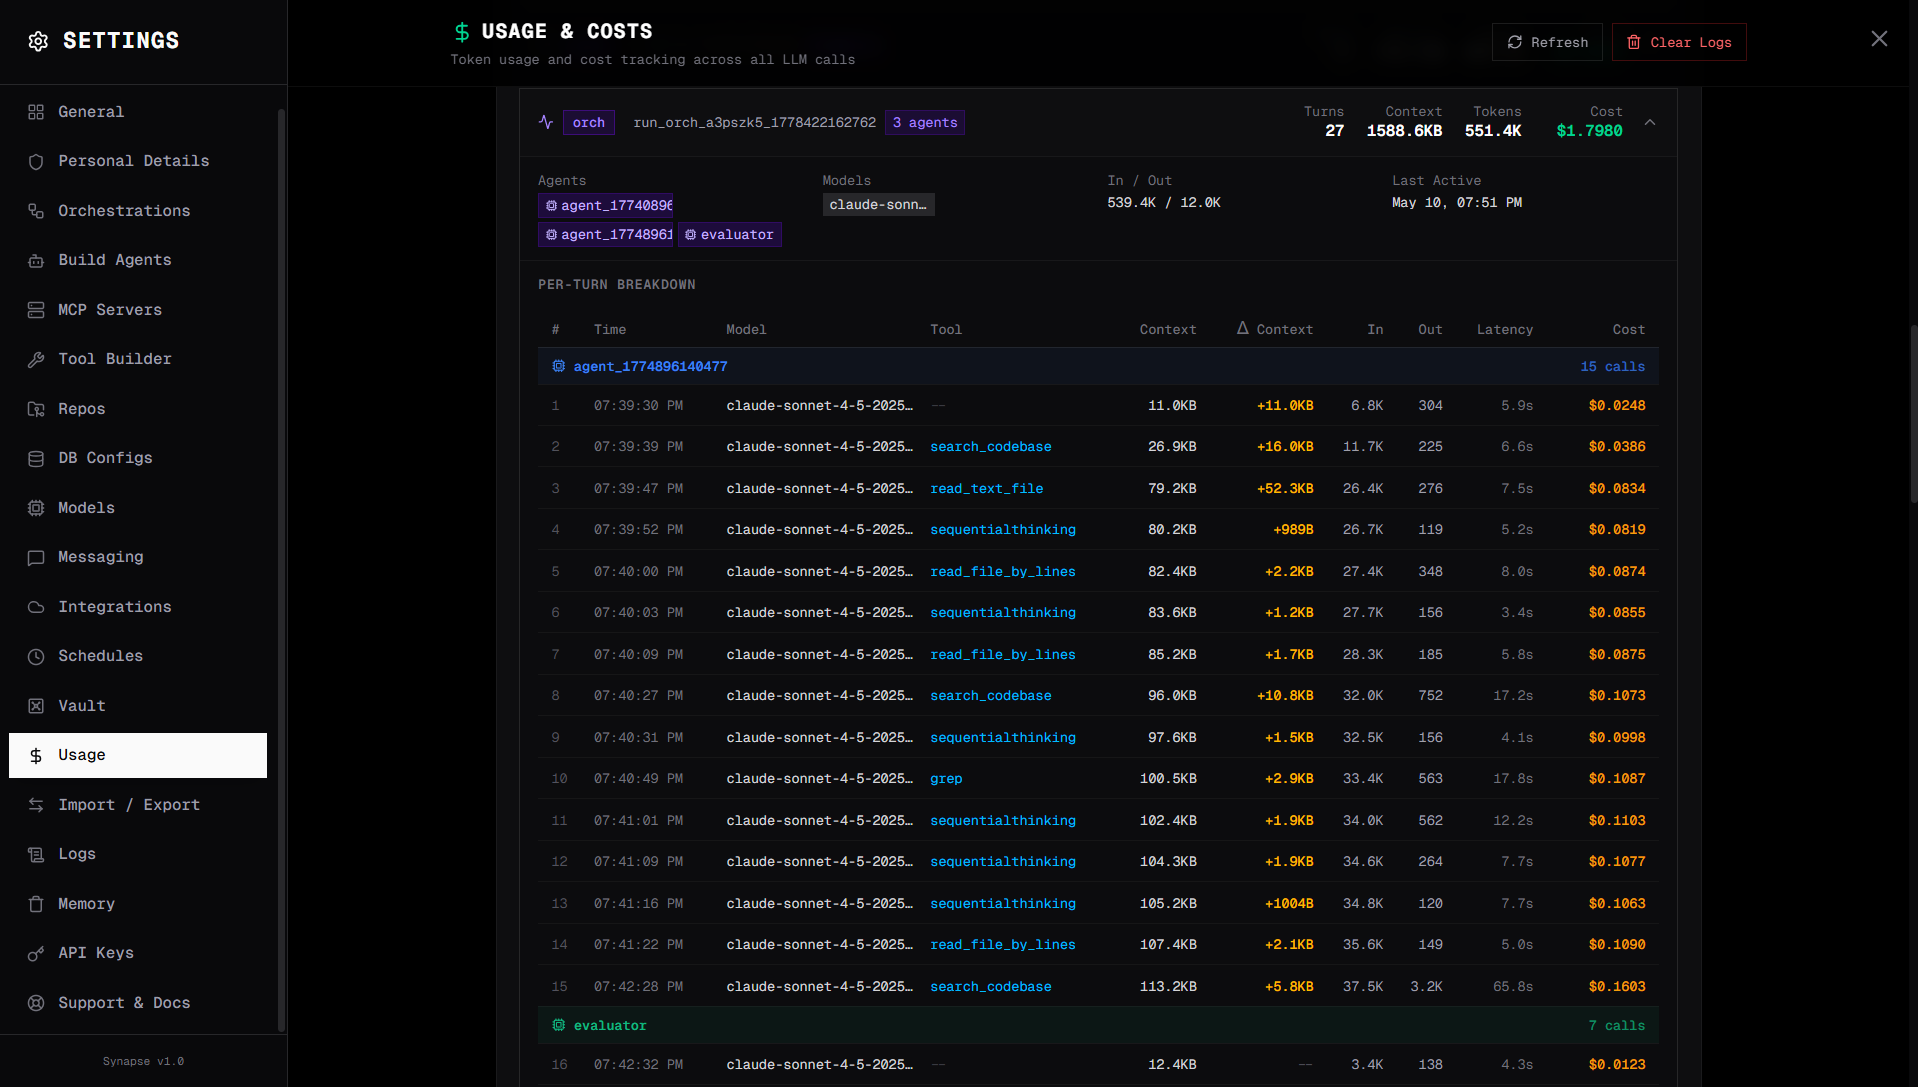
Cost tracking in orchestrations
Orchestrations track cumulative cost across all steps:
{
  "total_tokens_used": 15234,
  "total_cost_usd": 0.0234
}
If max_total_cost_usd is set on the orchestration, execution halts when the cost exceeds the budget. The run transitions to failed with a cost-limit error.
Cost estimates
Cost estimates are calculated based on published pricing for each model. They are approximate — actual costs may differ due to caching, batch discounts, or pricing changes. Always verify with your LLM provider's billing dashboard.
Log retention
Usage logs are stored in DATA_DIR/logs/. They are not automatically rotated — for long-running deployments, periodically archive or delete old log files to prevent disk growth.